
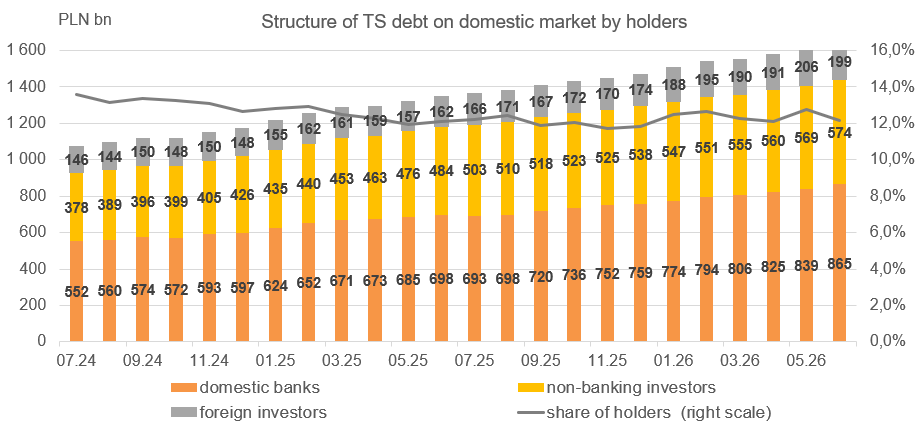
Structure of investors
In June, debt in domestic TS increased by PLN 23.3bn and amounted to PLN 1,638.3 billion. This was the result of an increase in debt towards domestic banks (including the NBP) and domestic non-bank investors by PLN 26.1bn (to PLN 865.4 billion) and by PLN 4.5bn (to PLN 574.0bn), respectively as well as a decrease in debt towards non-residents by PLN 7.3bn (to PLN 199.0 billion). As a result, the share of domestic banks (including the NBP) increased to 52.8% from 52.0% in May (51.6% at the end of December 2025), while the share of domestic non-banking investors in the domestic TS debt diminished to 35.0% from 35.3% in the previous month (36.6% at the end of December 2025). However, the share of non-residents in the domestic TS debt decreased to 12.1% compared to 12.8% in May (11.8% at the end of December 2025).
(A) The face value of Treasury Securities used as collateral of state budget deposits in commercial banks is presented in "Ministry of Finance" subcategory (within "General government institutions" category) and thus is deducted from the banking sector category.
| Nominal T-bonds and T-bills outstanding at the end of June 2026 (PLN million) | ||||
| T-bonds | T-Bills | Total | ||
| Banks | 831 887,13 | 21 376,69 | 853 263,82 | |
| Foreign investors* | 198 832,00 | 123,20 | 198 955,20 | |
| Insurance funds | 75 359,07 | 19,60 | 75 378,67 | |
| Pension funds | 38 651,61 | 0,00 | 38 651,61 | |
| Investment funds | 119 640,09 | 210,00 | 119 850,09 | |
| Households** | 191 402,99 | 2,05 | 191 405,04 | |
| Non-financial corporations** | 10 001,32 | 417,46 | 10 418,78 | |
| General government institutions | Total | 135 329,91 | 158,70 | 135 488,61 |
| Including MoF | 12 135,00 | 0,00 | 12 135,00 | |
| Others | 13 614,92 | 1 304,17 | 14 919,09 | |
| Total | 1 614 719,05 | 23 611,87 | 1 638 330,92 | |
(B) The face value of Treasury Securities used as collateral of state budget deposits in commercial banks was retained within "Banks" category and thus is not presented in "General government institutions" category.
| Nominal T-bonds and T-bills outstanding at the end of June 2026 (PLN million) | ||||
| T-bonds | T-Bills | Total | ||
| Banks | Total | 844 022,13 | 21 376,69 | 865 398,82 |
| Including MoF | 12 135,00 | 0,00 | 12 135,00 | |
| Foreign investors* | 198 832,00 | 123,20 | 198 955,20 | |
| Insurance funds | 75 359,07 | 19,60 | 75 378,67 | |
| Pension funds | 38 651,61 | 0,00 | 38 651,61 | |
| Investment funds | 119 640,09 | 210,00 | 119 850,09 | |
| Households** | 191 402,99 | 2,05 | 191 405,04 | |
| Non-financial corporations** | 10 001,32 | 417,46 | 10 418,78 | |
| General government institutions** | 123 194,91 | 158,70 | 123 353,61 | |
| Others | 13 614,92 | 1 304,17 | 14 919,09 | |
| Total | 1 614 719,05 | 23 611,87 | 1 638 330,92 | |
* The face value of Treasury securities located on Omnibus accounts (a form of securities register designed for non-residents) at the end of the month is included in “Foreign investors” category.
** As of September 2020, the category "households" replaced the existing category "individuals" and the category "non-financial corporations" replaced the category "non-financial entities". Domestic investors have been extended by category "General government institutions". The scope of entities included in these categories is described in the Regulation of the Minister of Finance of 8 June 2020.
Historical data are available in the file portfele.xls
Last update - 31.07.2026
Detailed information on institutional and geographical distribution of non-residents holdings is available in the following tables and in the attached files: Struktura_nierezydentów.xlsm, Nierezydenci_kraje.xlsx, Portfele_nierezydentów_po_seriach.xls. Additionally, a new category “omnibus accounts” was distinguished among foreign entities due to the fact that there is no possibility to identify investors entitled to securities registered on these accounts.
Institutional distribution of non-residents holdings in Treasury securities issued on the local market at the end of June 2026
| Institutional distribution of non-residents holdings in Treasury securities issued on the local market at the end of June 2026 (PLN million) | ||||
| T-bonds | T-Bills | Total | ||
| Banks | 13 167,47 | 7,96 | 13 175,43 | |
| Central banks | 15 499,67 | 0,00 | 15 499,67 | |
| Public institutions | 2 894,55 | 0,00 | 2 894,55 | |
| Insurance funds | 993,12 | 0,00 | 993,12 | |
| Pension funds | 17 188,81 | 0,00 | 17 188,81 | |
| Investment funds | 31 757,31 | 22,00 | 31 779,31 | |
| Hedge funds | 2 053,10 | 0,00 | 2 053,10 | |
| Households** | 720,75 | 0,00 | 720,75 | |
| Non-financial corporations** | 2 477,06 | 0,00 | 2 477,06 | |
| Others | 16 923,56 | 0,00 | 16 923,56 | |
| Total | 103 675,40 | 29,96 | 103 705,36 | |
| Omnibus accounts*** | 95 156,60 | 93,24 | 95 249,84 | |
| Non-residents total | 198 832,00 | 123,20 | 198 955,20 | |
Geographical distribution of non-residents holdings in Treasury securities issued on the local market at the end of June 2026
| Geographical distribution of non-residents holdings in Treasury securities issued on the local market at the end of June 2026 (PLN million) | ||||
| T-bonds | T-Bills | Total | ||
| Europe - eurozone | 44 170,37 | 4,50 | 44 174,87 | |
| Europe - EU non-eurozone | 2 053,65 | 22,00 | 2 075,65 | |
| Europe - non-EU | 10 590,30 | 3,46 | 10 593,76 | |
| Africa | 30,06 | 0,00 | 30,06 | |
| South America (incl. Caribbean) | 800,92 | 0,00 | 800,92 | |
| North America | 7 806,17 | 0,00 | 7 806,17 | |
| Australia and Oceania | 2 161,48 | 0,00 | 2 161,48 | |
| Asia (excl. Middle East) | 31 549,58 | 0,00 | 31 549,58 | |
| Middle East | 4 512,87 | 0,00 | 4 512,87 | |
| Total | 103 675,40 | 29,96 | 103 705,36 | |
| Omnibus accounts*** | 95 156,60 | 93,24 | 95 249,84 | |
| Non-residents total | 198 832,00 | 123,20 | 198 955,20 | |
*** Omnibus accounts – accounts run by direct participants of the National Depository (KDPW) who are not holders of securities registered on these accounts. Introduction of omnibus accounts facilitated foreign investors access to Polish Treasury securities market. Due to the previous regulations holding separate account dedicated for operations on Polish market was required which formed cost and organizational barrier.
Geographical distribution of central banks holdings in Treasury securities issued on the local market at the end of June 2026
| Geographical distribution of central banks holdings in Treasury securities issued on the local market at the end of June 2026 (PLN million) | ||||
| T-bonds | T-Bills | Total | ||
| Europe - eurozone | 0,00 | 0,00 | 0,00 | |
| Europe - EU non-eurozone | 0,00 | 0,00 | 0,00 | |
| Europe - non-EU | 0,00 | 0,00 | 0,00 | |
| Africa | 15,47 | 0,00 | 15,47 | |
| South America (incl. Caribbean) | 9,31 | 0,00 | 9,31 | |
| North America | 0,00 | 0,00 | 0,00 | |
| Australia and Oceania | 6,00 | 0,00 | 6,00 | |
| Asia (excl. Middle East) | 11 768,00 | 0,00 | 11 768,00 | |
| Middle East | 3 700,90 | 0,00 | 3 700,90 | |
| Total | 15 499,67 | 0,00 | 15 499,67 | |
Non-residents holdings in marketable T-bonds and T-bills
| Day | Non-residents holdings in marketable T-bonds and T-bills* (PLN million) | ||
| T-bonds | T-Bills | Total | |
| 01.06.2026 | 203 422,13 | 643,95 | 204 066,08 |
| 02.06.2026 | 204 455,44 | 643,95 | 205 099,39 |
| 03.06.2026 | 206 281,01 | 643,95 | 206 924,96 |
| 05.06.2026 | 205 307,44 | 643,95 | 205 951,39 |
| 08.06.2026 | 206 199,90 | 643,95 | 206 843,85 |
| 09.06.2026 | 204 743,87 | 643,95 | 205 387,82 |
| 10.06.2026 | 202 365,71 | 643,95 | 203 009,66 |
| 11.06.2026 | 201 184,97 | 643,95 | 201 828,92 |
| 12.06.2026 | 204 808,78 | 643,95 | 205 452,73 |
| 15.06.2026 | 196 755,65 | 642,25 | 197 397,90 |
| 16.06.2026 | 200 008,08 | 642,25 | 200 650,33 |
| 17.06.2026 | 199 902,92 | 642,25 | 200 545,17 |
| 18.06.2026 | 195 583,65 | 640,35 | 196 224,00 |
| 19.06.2026 | 198 410,59 | 640,35 | 199 050,94 |
| 22.06.2026 | 200 787,96 | 640,35 | 201 428,31 |
| 23.06.2026 | 201 446,71 | 145,35 | 201 592,06 |
| 24.06.2026 | 201 902,77 | 145,35 | 202 048,12 |
| 25.06.2026 | 201 843,29 | 145,35 | 201 988,64 |
| 26.06.2026 | 205 190,40 | 145,35 | 205 335,75 |
| 29.06.2026 | 201 144,47 | 145,35 | 201 289,82 |
| 30.06.2026 | 198 166,41 | 123,20 | 198 289,61 |
Historical data are available in the file nierezydenci.xls
Last update - 31.07.2026
Materials
Nominal T-bonds and T-bills issued on the domestic marketPortfele06.xls 0.65MB Nominal T-bonds issued on the domestic market by series
Portfele_po_seriach06.xls 2.68MB Nominal T-bonds issued on the domestic market held by non-residents by series
Portfele_nierezydentow_po_seriach06.xls 2.72MB Institutional and geographical distribution of non-resident's holdings in Treasury Securities issued on the domestic market
Struktura_nierezydentow06.xlsm 0.49MB Institutional and geographical distribution of non-resident's holdings in Treasury Securities issued on the domestic market
Nierezydenci_06.xls 0.51MB Non-residents' holdings in Treasury Securities issued on the domestic market by countries
Nierezydenci_kraje06.xlsx 0.33MB
- Last updated on:
- 31.07.2026 15:03 Anna Czarnecka
- First published on:
- 31.07.2019 15:02 Anna Czarnecka